Abstract
A marine fleet earns nothing from a vessel that cannot leave the dock, yet the public record of how recreational vessels come out of service is scattered across towing statistics, federal casualty reports, and insurer claims analyses that are rarely read together. This report assembles and classifies that record for the United States.
Three findings organize the evidence. First, unplanned mechanical trouble dominates on-water assistance demand: the largest national assistance network attributes 54% of its calls to mechanical breakdown, and 77% to the combination of mechanical, battery and electrical, fuel, and overheating causes [1]. Second, federal casualty reporting prices only the severe tail — roughly $88 million in reported property damage across 3,887 incidents in 2024 — and by construction understates the routine cost of downtime [3]. Third, in the most recent detailed claims analysis, 69% of insured sinking incidents occurred at the dock or mooring rather than underway — a statement about where sinkings happen, not about claim severity — placing the majority of observed sinkings in the hours when a vessel sits idle [4]. Public data does not support per-vessel breakdown rates or fleet-level downtime costs; this report states those gaps plainly rather than modeling around them.
Scope and research question
The question this report addresses: through what channels do recreational vessels in the United States come out of service; at what frequency and cost does the public record observe those channels; and what share of them is operationally manageable — meaning connected to systems and conditions that maintenance and operating practice act on?
Scope covers United States recreational vessels, including the shared fleets operated by boat clubs and rental businesses. Commercial shipping is excluded; its off-hire economics are not comparable to small-vessel fleets. The report is an analysis of public evidence only. It does not evaluate any product, does not estimate savings from any intervention, and makes no claim about what any monitoring or maintenance practice would have prevented.
Methodology and evidence classification
Sources fall into four classes: annual operating statistics published by BoatUS covering its TowBoatUS on-water assistance network [1][2]; federal casualty reporting from the United States Coast Guard [3]; insurance-claims analyses published by BoatUS through its Seaworthy program [4]; and corporate disclosures about fleet-scale operations [5][6], used only for context on operating practice. One of the latter is a vendor-published case study, and its commercial interest is noted where it is cited.
Every quantitative statement belongs to one of three classes:
- Observed — a figure as published by the named source, cited at the point of use.
- Derived — arithmetic on observed figures, with the calculation shown where the number appears.
- Inference — analytical judgment about what observed figures imply, flagged in the text and never presented as measurement.
Each reference was resolved and checked against the publisher's page on August 12, 2026. Figures that could not be verified against a publisher were omitted. The report contains no private, pilot, prospect, or customer data and no Suntiq operational data.
Key findings
Mechanical and energy-system failure is the dominant observable cause of unplanned interruption on the water. BoatUS attributes 54% of on-water assistance calls to mechanical breakdown, 9% to battery and electrical problems, 9% to suspected fuel problems, and 5% to engine overheating [1] — 77% combined (derived: 54 + 9 + 9 + 5). The largest non-mechanical cause, running aground, adds 12% and is situational rather than mechanical.
The retail price of an interruption is observable only at its edges. A non-member tow averaged $1,091 out of pocket in the most recent BoatUS release [1], up 2.9% from $1,060 in the release before it [2] (derived). At the far edge, repairing a boat that has been submerged typically costs about 40% of hull value [4]. Between those edges — the daily cost of a vessel out of service to a club or rental operator — no audited public figure exists.
The federal casualty record is a floor, not a measure, of downtime cost. The Coast Guard counted 3,887 reportable incidents in 2024, with 556 deaths, 2,170 injuries, and roughly $88 million in property damage; machinery failure ranked among the top five primary contributing factors [3]. The casualty record and the assistance record observe different portions of the interruption problem under different definitions: a routine breakdown that ends in a tow is not a reportable casualty, and the two datasets cannot be ratioed against each other. What the casualty record prices, by construction, is only the severe end.
Most observed sinkings happen while vessels sit idle. In the most detailed public claims analysis, 69% of insured sinking incidents occurred at the dock or mooring; about half of sinkings involved leaks at underwater fittings, and 32% involved accumulating rain or snow [4]. These are incidence shares — the analysis does not report the distribution of claim severity or paid loss. Because fleet vessels spend most of their lives idle, the at-rest sinking modes it describes are directly relevant to fleet operation — an inference from incidence structure, not a measured fleet statistic.
The failure surface is connected
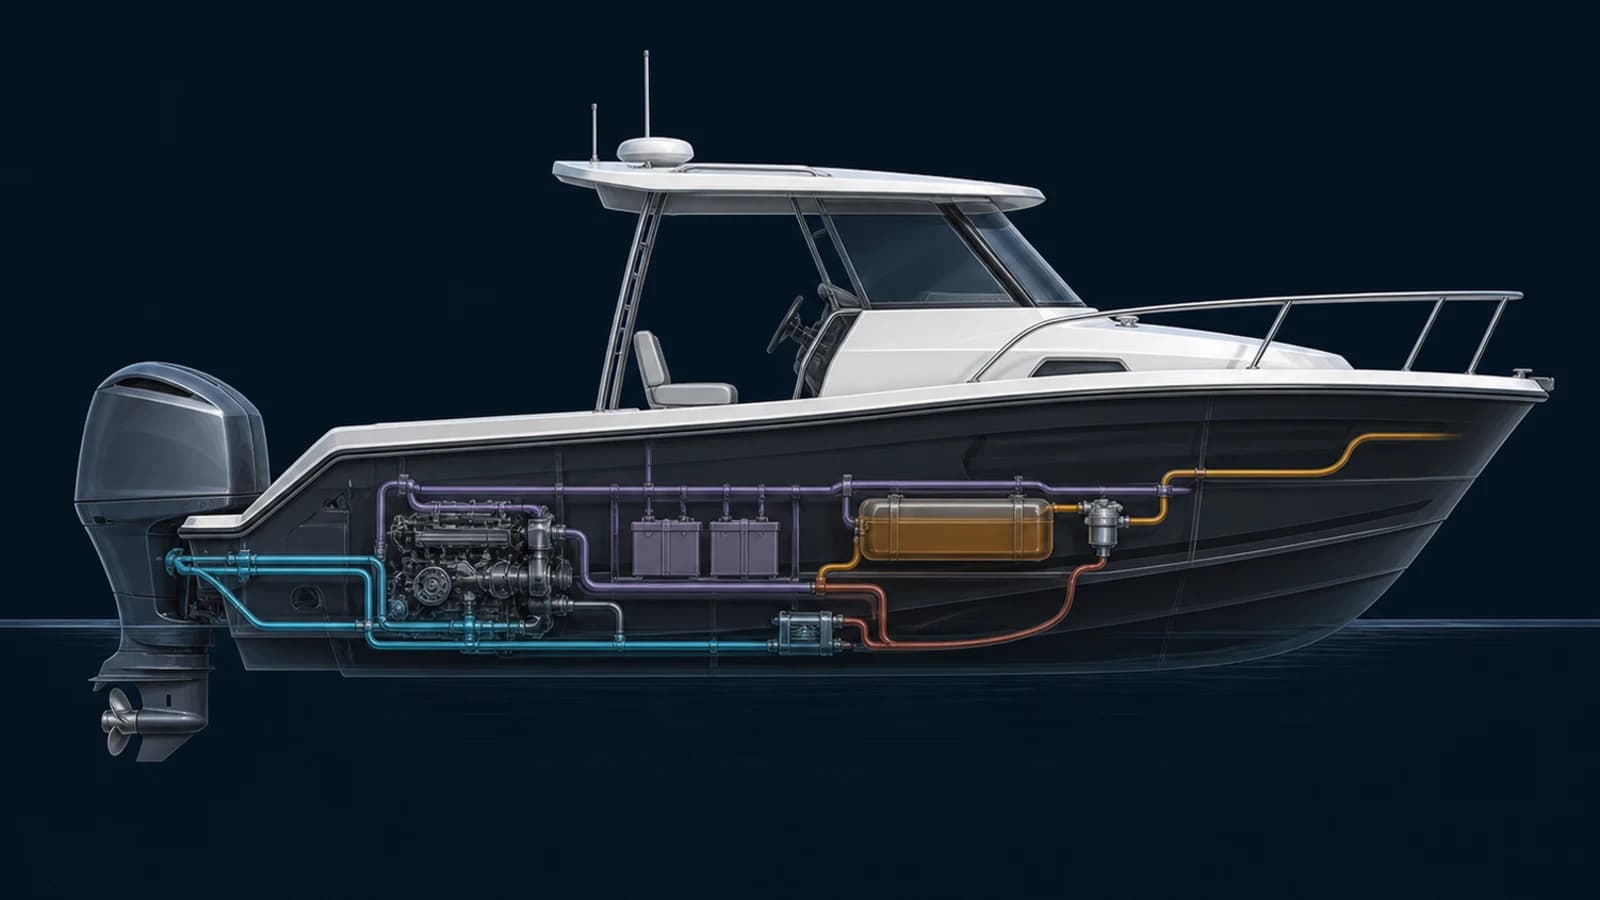
A technical cutaway turns four reported failure channels into a single marine systems image without pretending they occurred on one vessel. Illustration: Suntiq. Analytical basis: [1].
1. The unit of account is the available vessel-day
A boat club sells its members access to a fleet; a rental or charter operator sells time on the water. In both models, revenue is a function of vessels available for use, while a vessel out of service produces nothing and continues to accrue storage, insurance, financing, and repair cost. Availability — not hull count — is the binding economic quantity. This is a structural observation about the business model, not a measured elasticity.
The population at issue is large. The Coast Guard reports a 2024 fatality rate of 4.8 deaths per 100,000 registered recreational vessels alongside 556 total deaths [3], which implies roughly 11.6 million registered recreational vessels (derived: 556 ÷ 4.8 × 100,000). Shared-access fleets are a small but highly organized fraction of that population: Freedom Boat Club, the largest club operator, reports more than 400 locations across North America, Europe, Australia, and New Zealand [5].
Downtime itself is not publicly measured. No fleet operator publishes per-vessel down-days, and no agency collects them. This report therefore reads the public traces downtime leaves behind: calls for assistance when vessels fail underway, federal reports when failures become casualties, and insurance claims when vessels are damaged or lost at rest.
2. What interrupts service on the water
The closest thing to a national ledger of on-water failure is the annual statistical release of BoatUS, whose TowBoatUS network dispatches assistance across United States coastal and inland waters. The 2025 release reports 111,928 requests for on-water assistance in the trailing year [1]; the 2024 release reported 113,632 [2] — demand has held near 112,000 to 114,000 across the two most recent releases (a 1.5% decline, derived). The average non-member paid $1,091 out of pocket per assistance event [1].
Why vessels call for help underway
Reported causes of on-water assistance requests across the TowBoatUS network, 2025 release. Four mechanical and energy-system categories — the systems maintenance already touches — account for 77% of calls.
- Mechanical and energy systems
- Mechanical breakdownengine, transmission, drives54%
- Battery or electrical failure9%
- Suspected fuel problems9%
- Engine overheating5%
- Combinedderived: 54 + 9 + 9 + 577%
- Situational and unitemized
- Running agroundsituational, not mechanical12%
- Other causesnot itemized in the release11%
Source: BoatUS, By the Numbers 2025 (TowBoatUS network) [1]. Shares describe request volume on one network — the largest, but not the whole market — and are not normalized by active vessels, so they are not per-vessel failure rates. The release itemizes 89% of requests; the 77% line is arithmetic on published shares. The chart shows what failed, not what any maintenance regime would have prevented.
The structure of the table matters more than its level. Nearly four in five requests trace to the powertrain and energy systems of the vessel — engine, drivetrain, batteries, fuel, and cooling. These are the systems whose condition operators already inspect and service. The one large exception, running aground at 12%, is a situational failure with a different operational lever entirely.
3. The casualty record prices only the tail
Federal statistics capture the failures severe enough to become casualties. For 2024, the Coast Guard reports 3,887 incidents, 556 deaths, 2,170 injuries, and approximately $88 million in property damage, with machinery failure among the top five primary contributing factors [3].
| Indicator | Value |
|---|---|
| Reported incidents | 3,887 |
| Deaths | 556 |
| Injuries | 2,170 |
| Reported property damage | ≈ $88 million |
| Fatality rate per 100,000 registered vessels | 4.8 |
| Mean property damage per reported incident (derived) | ≈ $22,600 |
Source: United States Coast Guard [3]. The derived mean is $88 million ÷ 3,887 incidents; because reporting is thresholded, it describes the reported population only.
The $88 million figure is therefore a floor on the cost of severe outcomes, not a measure of downtime. The assistance record in Section 2 and the casualty record here describe different populations under different definitions, and some events may appear in both, so no ratio between the two is meaningful. Read side by side, they observe different portions of the interruption problem: one records routine assistance events, the other prices the severe tail, and no public dataset joins them.
4. Losses at rest
The most detailed public evidence on where boats are lost comes from the BoatUS Seaworthy analysis of the association's 2012 insurance claims files, published in 2014 [4]. Its central result inverts the intuitive picture: most insured sinking incidents do not happen in rough water underway. They happen at the dock.
Where insured boats sink
The 2012 BoatUS claims analysis locates most insured sinking incidents at the dock or mooring, not underway. These are incidence shares — counts of where sinkings happened — and say nothing about claim severity.
Of every 100 insured sinkings
In the BoatUS analysis of 2012 insurance claims, 69 of every 100 insured sinkings occurred at the dock or mooring and 31 occurred underway.
Recorded modes, across all analyzed sinkings
- ≈ 50 of 100 involved leaks at underwater fittings
- 32 of 100 involved accumulated rain, snow, or sleet
Source: BoatUS Seaworthy, analysis of 2012 insurance claims files [4]. All figures are incidence shares within one insurer's claims; the analysis does not report claim severity or paid loss, and no comparably detailed refresh has been published. The same analysis puts typical repair cost after submersion at roughly 40% of hull value — a repair-cost observation, not a severity comparison between locations.
For a fleet, the relevance is structural. A club or rental vessel spends most of its hours idle between uses, and the claims record places the majority of observed sinking incidents precisely there — in slow processes of wear at underwater fittings and accumulation of precipitation, the kinds of condition that dockside inspection routines exist to catch. Two boundaries on that reading: the analysis reports where sinkings happen, not the distribution of claim severity or paid loss, so it ranks incidence rather than financial exposure; and the association between at-rest sinking modes and inspection practice is an inference — the analysis does not measure what any given routine prevents.
5. Operating discipline at fleet scale
Little is published about maintenance operations inside large recreational fleets. Freedom Boat Club, the largest shared-access operator, discloses its footprint — more than 400 locations [5] — but not per-vessel maintenance cost or downtime. The one public account of its maintenance practice comes through a vendor channel: in a case study published by Fleetio, a maintenance-software company with an evident commercial interest in the result, a Freedom Boat Club franchise operator reports meeting maintenance schedules “90 to 95 percent of the time” after moving from paper records to software [6].
What that account supports is narrow. It shows that a professional operator tracks maintenance-schedule compliance as an operating metric, and it supplies one unaudited, vendor-published value for that metric. It does not reveal maintenance cost, down-days, the causes of the remaining noncompliance, or the effect of any intervention — and the public record contains no independent measurement of those quantities for recreational fleets.
Limitations
The central limitation is the absence of a denominator. Assistance volumes describe demand on one network and are not normalized by active vessels, so no per-vessel breakdown rate can be computed from public data. The federal casualty record is thresholded and therefore excludes almost all economically routine downtime. The sinking analysis, while uniquely detailed, rests on claims files from 2012 and describes one insurer's book; its shares are treated here as structural, not current.
Fleet-specific economics are thinner still. No boat club or rental operator publishes audited per-vessel maintenance costs, down-days, or the revenue forgone per day out of service, and the one account of fleet maintenance practice used here is vendor-published. Commercial-shipping off-hire rates were considered as an analogue and excluded as not like-for-like. Finally, no published study quantifies how much recreational downtime any preventive practice eliminates; for that reason this report contains no savings estimates of any kind. Where the evidence is thin, the honest move is a narrower claim, and that is the move made here.
Conclusion
The public record supports a narrower but firmer statement than the industry usually makes. The dominant observable causes of interruption underway are mechanical and energy-system failures — 77% of assistance calls on the largest national network. The severe tail is priced at roughly $88 million a year in reported damage, and the retail edges of an interruption are priced at $1,091 for an average non-member tow and roughly 40% of hull value after a submersion. And the majority of insured sinking incidents arise not in heavy weather offshore but from slow failure at the dock, where fleet vessels spend most of their lives.
What the record does not support is any claim about prevention rates or fleet savings. The per-vessel economics of downtime — how many days a fleet vessel is unavailable each season and what each of those days costs — remain unmeasured in public. For an industry whose revenue model is availability, that missing measurement is itself the finding.
References
- BoatUS By the Numbers 2025 — Boat Owners Association of The United States, News Room, July 30, 2025.Cited for: Annual on-water assistance volume (111,928 requests), the $1,091 average non-member towing cost, and the cause shares in Exhibit 1.
- BoatUS By the Numbers 2024 — Boat Owners Association of The United States, News Room, July 11, 2024.Cited for: Prior-release assistance volume (113,632 requests) and average non-member towing cost ($1,060).
- 2024 Recreational Boating Statistics (COMDTPUB P16754.38) — United States Coast Guard, 2025.Cited for: Reported incidents, deaths, injuries, and property damage for 2024; the fatality rate per 100,000 registered vessels; federal reporting criteria; and machinery failure ranking among the top five primary contributing factors.
- Why Boats Sink — BoatUS, Seaworthy — analysis of 2012 insurance claims files, June 2014.Cited for: Dock-versus-underway sinking shares, underwater-fitting and precipitation causes, and the typical repair cost of a submerged boat relative to hull value.
- Freedom Boat Club Named to Entrepreneur's 2025 Top Global Franchises List — Brunswick Corporation, press release, November 6, 2025.Cited for: Freedom Boat Club location count (more than 400).
- Freedom Boat Club (customer case study) — Fleetio, vendor-published, Undated.Cited for: Operator-reported maintenance-schedule compliance of 90–95%. A vendor account with a commercial interest in the result; treated as a single unaudited data point.